Natural Gas Spot Prices Declined Across Major Trading Hubs Last Year: EIA
The average natural gas spot price at the majority of the main trading hubs in the Lower 48 states declined during 2024 compared to the previous year in real terms, according to an Feb. 3 report published by the U.S. Energy Information Administration. The price decline can be attributed to mild winter temperatures, robust U.S. natural gas production and relatively high natural gas stocks in the main storage regions.
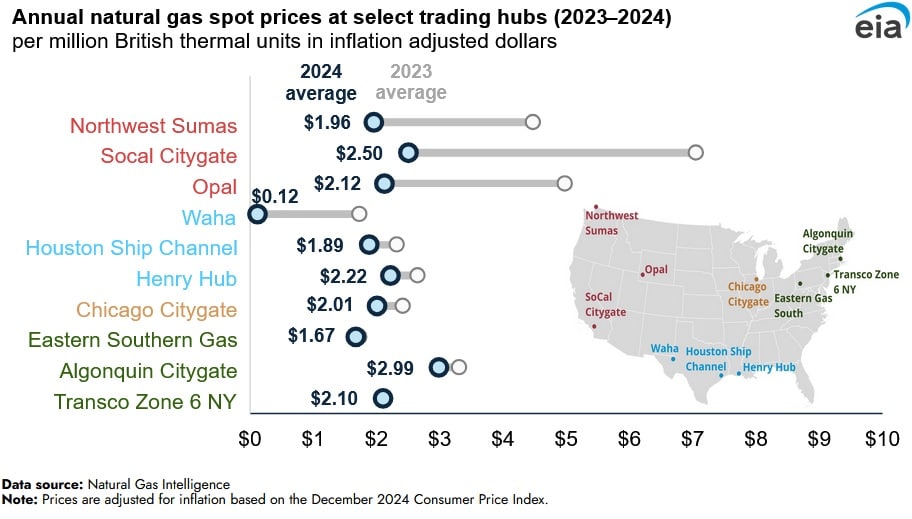
Spot natural gas prices at the Henry Hub, which serves as the U.S. benchmark, averaged $2.22/ per million British thermal units (MMBtu) during 2024, the lowest average annual price in inflation-adjusted dollars ever reported. Natural gas prices in the Northeast at Algonquin Citygate and Eastern Gas South averaged $0.32/MMBtu and $0.06/MMBtu lower in 2024, respectively, and western prices at Northwest Sumas and SoCal Citygate averaged $2.51/MMBtu and $4.55/MMBtu lower compared with 2023, respectively. In West Texas, prices at the Waha Hub near Permian Basin production activities traded below zero for 42 percent of trading days in 2024 as natural gas production from the Permian Basin outpaced available pipeline takeaway capacity.
The bearish sentiment evident in the U.S. natural gas market was underpinned by relatively full storage levels. The U.S. ended the winter 2023-24 season with 2,290 billion cubic feet (Bcf) of gas in storage sites, 39 percent above the previous five-year average. The increase in storage capacity during the winter compared to other winters can be attributed to mild weather, reduced consumption and robust natural gas production. According to the National Oceanic and Atmospheric Administration (NOAA) the U.S. experienced its warmest winter on record. Higher temperatures have led to lower gas demand for household consumption and therefore lower demand overall. Moreover, both the commercial and residential sectors used less gas than previous winters and as a result less gas was used from storage sites to fulfil demand. During the winter, around 1,500 Bcf of gas was withdrawn from storage sites compared to 2,000 Bcf during previous winters.
U.S. natural gas demand growth was constrained by marginal changes in the U.S. liquefied natural gas capacity and flat U.S. natural gas net exports. Moreover, injection demand for storage sites was low during the summer period, with the U.S. entering the winter 2024-25 period, with the highest storage level since 2016.
EnerKnol Pulses like this one are powered by the EnerKnol Platform—the first comprehensive database for real-time energy policy tracking. Sign up for a free trial below for access to key regulatory data and deep industry insights across the energy spectrum.
ACCESS FREE TRIAL