U.S. Natural Gas Prices Less Volatile During 2023 Compared to 2022: EIA

The average price of U.S. natural gas declined during 2023 compared to 2022 and became less volatile, according to a June 4 report published by the U.S. Energy Information Administration.
Price volatility increased during 2022, following the Russian invasion of Ukraine and the cessation of Russian pipelined gas to Europe. The Russian invasion of Ukraine, has led to a shift in global trading dynamics and increased the European markets reliance on U.S. Liquefied Natural Gas (LNG) to fulfil domestic demand. This in turn, has led to higher U.S. natural gas prices and helped globalise the natural gas market.
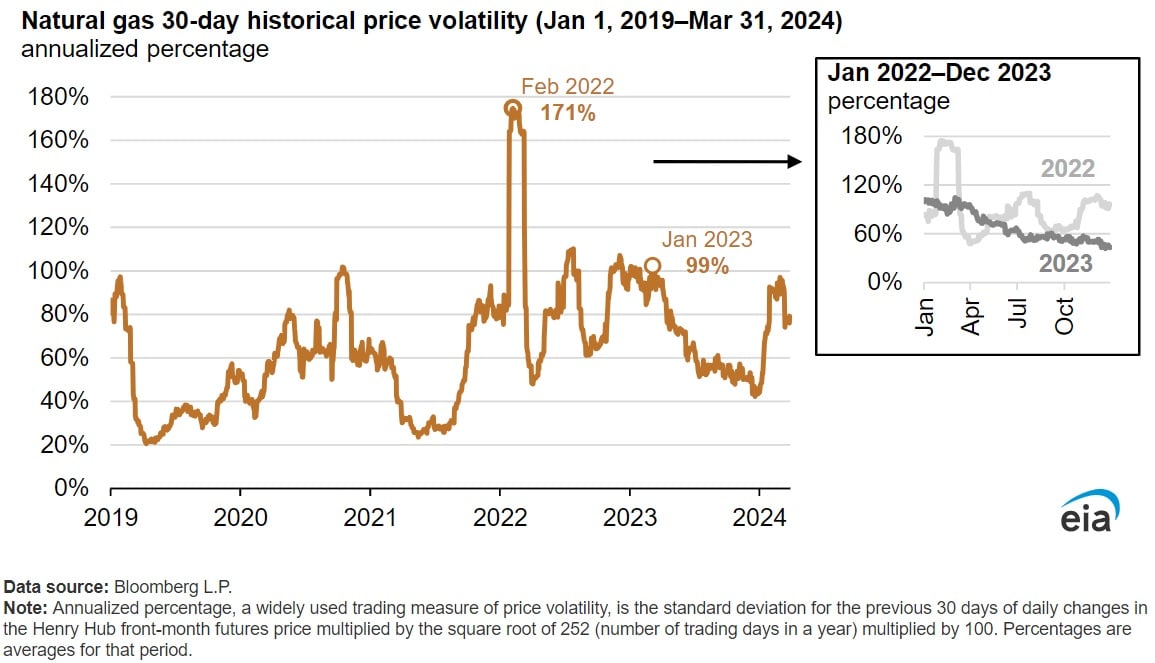
Historical volatility as defined by the agency relates near time price movements to average prices over a certain period, reached 171 percent for U.S. natural gas in February 2022, the most volatile since at least 1994. Moreover, volatility averaged 69 percent in 2023 compared to 91 percent across 2022. During 2023, gas storage inventories remained above the five-year (2018-2022) average and market conditions remained largely stable, with no major disruptions to supply and this contributed to the lower prices volatility.
Moreover, U.S. natural gas prices were less volatile during 2023 due to above seasonal normal temperatures during winter 2022 leading to lower gas demand for household consumption. As a result, this led to higher storage levels than anticipated at the end of the winter season. This in turn resulted in lower storage injection demand during summer 2023 and helped reduce both U.S. natural gas prices and volatility. During 2024, U.S. natural gas prices have declined to record lows, despite this there has been increased volatility. The increase in volatility during 2024 can be attributed to geopolitical tensions, which include both the Russian- Ukraine conflict and the uncertainty in the Middle East.
Monthly average historical natural gas price volatility peaked in February 2022 and was largely lower through the second quarter of 2022, before rising to 105 percent in July. The increase in volatility in July can be attributed to the explosion at the Freeport LNG export terminal in June. Historical price volatility generally declined throughout 2023, with volatility recording a record low of 47 percent in December 2023, due to its being warmest on record across many U.S. regions. Moreover, monthly U.S. natural gas production reached record highs during this month.
Historical price volatility during February 2024 was recorded at 92 percent and has been driven by disruptions to natural gas production, higher gas demand for household consumptions and high storage withdrawals during January, due to Winter Storm Heather. High amounts of gas in storage generally leads to lower price volatility, as gas from storage can be utilized to fulfil demand during supply shock events.
EnerKnol Pulses like this one are powered by the EnerKnol Platform—the first comprehensive database for real-time energy policy tracking. Sign up for a free trial below for access to key regulatory data and deep industry insights across the energy spectrum.
ACCESS FREE TRIAL