Feed Gas to U.S. LNG Facilities Reach Record High Levels During First Half of 2023: EIA

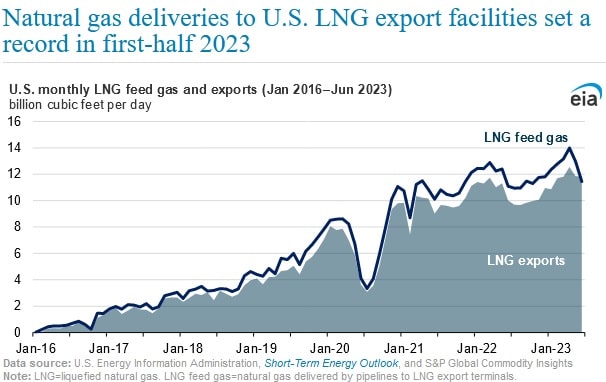
LNG feed gas – natural gas deliveries by pipelines to U.S. liquefied natural gas export facilities – averaged 12.8 billion cubic feet per day during the first half of this year, up 0.5bcf/d or 4 percent compared to the same period in 2022 and 1 bcf/d or 8 percent higher than the annual average in 2022, according to a July 31 report from the U.S. Energy Information Administration based on data by S&P Global Commodity Insights.
The increase in LNG feed gas can be attributed to the return of the Freeport LNG terminal to commercial operations in February 2023. A fire at Freeport LNG’s natural gas liquefaction plant led to the full shutdown of the facility in June 2022, reducing total U.S. LNG export capacity by around 2bcf/d or 17 percent of total U.S. LNG export capacity.
Robust demand for U.S. LNG exports from Europe, due to the Russian invasion of Ukraine and the structural change in the trade dynamics has been a key driver for LNG feed gas so far in 2023 and a vital contributor to LNG feed gas setting a monthly record in April 2023 at 14 bcf/d. Maintenance at a number of LNG export facilities, including Sabine Pass and Cameron led LNG feed gas to decline in May and June, averaging 13 bcf/d and 11.5 bcf/d respectively.
LNG feed gas volumes are in general higher than LNG export levels since LNG export terminals use feed gas to utilize liquefaction machinery. The freeport LNG terminal is an exception to the other U.S. LNG export capabilities, in that it uses electric motors instead of natural gas turbines to drive refrigerant compressors to alter natural gas from a gaseous to LNG.
EIA projects U.S. LNG exports to average 12 bcf/d in 2023 and 13.3 bcf/d in 2024. The projections for higher exports are based on the assumption that two additional LNG liquefaction plants will come online, the Golden Pass and Plaquemines. The agency’s forecast is expected to be impacted by global economic fundamentals and global gas demand, particularly in Europe and Asia.
EnerKnol Pulses like this one are powered by the EnerKnol Platform—the first comprehensive database for real-time energy policy tracking. Sign up for a free trial below for access to key regulatory data and deep industry insights across the energy spectrum.
ACCESS FREE TRIAL