Natural Gas Markets Driven by Regional Factors Compared to Crude Oil: EIA

Natural gas markets have a tendency to react to regional factors while crude oil markets respond swiftly and most times drastically to world events, according to a April 29 report from the U.S. Energy Information Administration.
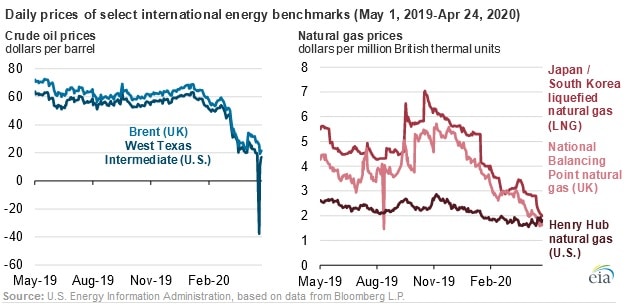
The correlation of daily price movements across the West Texas Intermediate, or WTI, and Brent are typically above 0.90. However recent volatility in the spread between the prices lowered the number to 0.44. Measures of correlation range from positive one, which indicates a very strong relationship in the same direction, to negative one, which shows a strong relationship for movements in opposite directions. By comparison, the U.S. Henry Hub, Asia’s Japan/Korea LNG (JKM), and the UK National Balancing Point (NBP) international natural gas benchmarks show slight correlation indicating little to no relationship between daily returns. Historically, natural gas contract prices have been, in part, determined by crude oil prices. However, in the present situation, comparing crude oil benchmarks to the international benchmarks for natural gas shows little correlation.
Crude oil is mainly transported by tanker or pipeline, and refiners trade in short-term contracts usually acquiring oil 90 days in advance. Differences among crude oils, such as density and sulfur content influence the price. Events that lead to shortage or surplus in one region can quickly impact prices, creating arbitrage opportunities by moving oil to other places
On the other hand, the quality of natural gas is standardized as it enters the pipeline delivery system. Although primarily transported by pipeline, natural gas is also shipped by tankers in the liquefied form. The conversion process for liquefied natural gas, or LNG, is expensive, leading to costs sometimes being higher than the input cost of natural gas.
In the past, natural gas trade has been hindered by high costs and transportation logistics which kept regional markets isolated. However, the number of LNG importers and exporters hiked in 2019 leading to a trade volume increase of 34 percent, in response to rising global demand.
EnerKnol Pulses like this one are powered by the EnerKnol Platform—the first comprehensive database for real-time energy policy tracking. Sign up for a free trial below for access to key regulatory data and deep industry insights across the energy spectrum.
ACCESS FREE TRIAL