Oil Flow Around Cape of Good Hope Rises Nearly 50 Percent Amid Red Sea Disruptions: EIA

Tensions in the Middle East have led to trade disruptions through the Red Sea and increased crude oil and oil product flows around the Cape of Good Hope, which is located at the southern tip of Africa, according to a June 11 report published by the U.S. Energy Information.
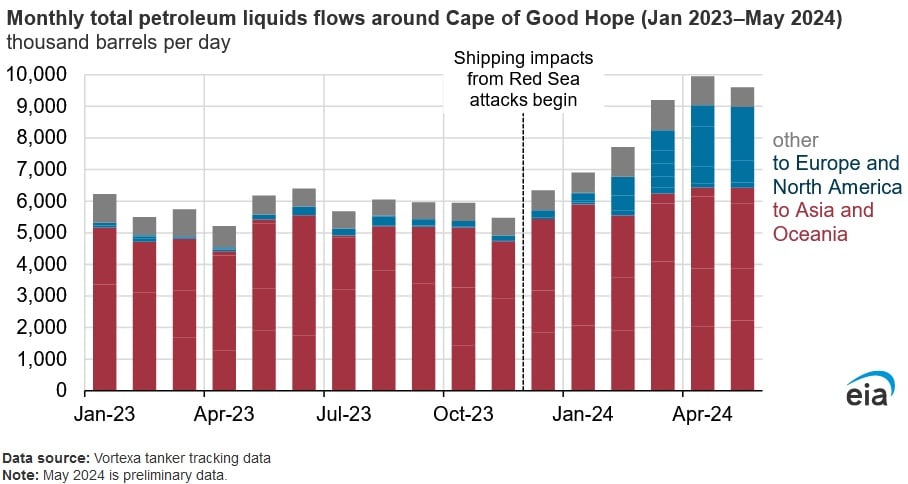
The quantity of crude oil and oil products flowing around the Cape of Good Hope rose by approximately 50 percent in the first five months of 2024, compared to a similar period in 2023. Commercial vessels decided to take a longer and more expensive route, in order to avoid chokepoints in the Middle East.
In response to attacks by Yemen-based Houthi militants in late 2023, many commercial vessel operators have sought for alternative routes to avoid the Bab el-Mandeb Strait and the Red Sea, off Yemen’s coast.
The amount of crude oil and oil products flowing around the Cape of Good Hope in both directions increased to 8.7 million barrels per day (b/d) during the January to May period of 2024, compared to an average of 5.9 million b/d during a similar period in 2023. The diversion of commercial vessels around the Cape of Good Hope has led to higher costs and shipping times. The Cape of Good Hope route can add thousands of miles and two to three weeks of voyage time compared with a journey transiting the Red Sea, contingent on origin and destination.
Saudi Arabia and Iraq shipped more crude oil around the Cape of Good Hope westbound to Europe than via the Suez Canal. Asian and Middle Eastern refiners increased their oil product exports to Europe and diverted vessels westbound around the Cape of Good Hope. The U.S. received crude oil and oil products from the Middle East and Asia and exported more oil products to Asia via the Cape of Good Hope. In the first five months of 2024, total U.S. trade around the cape rose by approximately one-third compared to the 2023 average. Russia sent around four times more crude oil and oil products to Asia around the Cape of Good Hope during the first five months of 2024, compared to the average during the whole of 2023.
EnerKnol Pulses like this one are powered by the EnerKnol Platform—the first comprehensive database for real-time energy policy tracking. Sign up for a free trial below for access to key regulatory data and deep industry insights across the energy spectrum.
ACCESS FREE TRIAL